Network Observability Deep Dive in Kubernetes with NetObserv Operator
How can we analyze our Network Flows in our Kubernetes clusters? How can we enable Network Observability for Kubernetes in a simple, searchable and visual way? How can we leverage cool technologies such as eBPF or IPFIX to enable Network Observability for our K8s Network Traffic?
Let’s dig in!
This is the third blog post of Network Observability in Kubernetes / OpenShift.
Check the earlier posts in:
- I - Monitoring and analysis of Network Flow Traffic in OpenShift
- II - Monitoring and analysis of Network Flow Traffic in OpenShift
Let’s dig in!
1. Overview
In earlier posts we saw how we can extract the network flows from our SDN (OVN-Kubernetes in our case) and analyze them to understand what’s happening in our k8s SDN networks. And also how we can leverage tooling like EFK stack to have a nice UI to search and build custom dashboards in order to provide us information about the Network Flow traffic among other useful interesting data.
But this is not the only approach to enable the Network Observability in K8s / OpenShift. Entering NetObserv Operator!
NetObserv Operator is a Kubernetes / OpenShift operator for network observability. This operator deploys a monitoring pipeline collecting and enriching Network traffic Flows.
These flows can be produced by:
- NetObserv eBPF agent
- Any Device or CNI able to export flows in IPIX format (like OVN-Kubernetes)
The operator provides dashboards, metrics, and keeps flows accessible in a queryable log store, Grafana Loki.
Let’s install it and start to play with this operator, to see how it can help us in our Network Observability for our Kubernetes / OpenShift clusters.
NOTE: This Blog Post is tested in OpenShift 4.10.16 but can work from 4.10+ versions. Also can work in Kubernetes adapting the manifests to not use OLM or installing OLM in Kubernetes.
All the resources used in this blog post are located in my personal GitHub repo, so let’s clone it first of all:
git clone https://github.com/rcarrata/ocp4-network-security.git
git checkout netobserv
cd netobserv
2. Installing NetObserv Operator Prerequisites
NetObserv Operator relies on several Open Source (Grafana and Grafana Loki) projects to provide dashboards, metrics and store the network flows to be queryable after.
So first of all we need to install them and configure them to be used by the Network Observ Operator.
- Create namespace for the network observability in k8s/OCP:
kubectl create ns netobserv
2.1 Installing and Configuring Grafana Loki
Loki is a horizontally scalable, highly available, multi-tenant log aggregation system inspired by Prometheus. It is designed to be very cost effective and easy to operate. It does not index the contents of the logs, but rather a set of labels for each log stream.
- Install Grafana Loki in k8s/OCP within the namespace of the network observability:
kubectl apply -k manifests/loki/base
- Loki will use a ConfigMap defining the local-config.yaml configuration with the parameters needed:
kubectl -n netobserv get cm loki-config -o yaml

apiVersion: v1
kind: ConfigMap
metadata:
  name: loki-config
data:
  local-config.yaml: |
    auth_enabled: false
    server:
      http_listen_port: 3100
      grpc_listen_port: 9096
      http_server_read_timeout: 1m
      http_server_write_timeout: 1m
      log_level: error
    target: all
    common:
      path_prefix: /loki-store
      storage:
        filesystem:
          chunks_directory: /loki-store/chunks
          rules_directory: /loki-store/rules
...
NOTE: check all the configuration parameters in the Loki CM.
- Check that the Loki pod is up and running:
kubectl get pod -n netobserv
NAME                                                   READY   STATUS    RESTARTS   AGE
loki                                                   1/1     Running   0          5m7s
2.2 Installing Grafana Operator and Deploy a Grafana instance for NetObserv
Grafana can be used to retrieve and show the collected flows from Loki. We can deploy Grafana using the Grafana Operator and configure a Grafana dashboard. Furthermore, we can add a new Loki data source to show the collected Network Flows.
- Install Grafana Operator:
kubectl apply -k manifests/grafana-operator/overlays/operator
- Check the Subscription and the CSV (Cluster Service Version) of the Grafana Operator
kubectl get csv -n netobserv | grep grafana

grafana-operator.v4.8.0                  Grafana Operator                           4.8.0                  grafana-operator.v4.7.1                        Succeeded
- Deploy Grafana instance, the Grafana Dashboard and a Grafana Datasource (Loki)::
kubectl apply -k manifests/grafana-operator/overlays/instance/overlay
- Check the Grafana pods are up && running:
kubectl get pod -n netobserv -l app=grafana

NAME                                  READY   STATUS    RESTARTS   AGE
grafana-deployment-658565d796-f5nj9   2/2     Running   0          29s
- Check the Grafana Data Source configured and managed to collect the Flows from Loki:
kubectl get grafanadatasource -n netobserv grafana-datasources -o jsonpath='{.spec}' | jq -r .
{
  "datasources": [
    {
      "access": "proxy",
      "isDefault": true,
      "name": "loki",
      "type": "loki",
      "url": "http://loki:3100",
      "version": 1
    }
  ],
  "name": "loki"
}
- Check that the Grafana Dashboard is deployed:
kubectl get grafanadashboard -n netobserv

NAME                AGE
netobsv-dashboard   63s
3. Installing NetObserv Operator
NetObserv Operator is available in OperatorHub so we can install it using OLM.
- Install the Operator with the latest version available (currently v2.1):
kubectl apply -k manifests/netobserv/operator/overlays
- Check the ClusterServiceVersion of the Operator:
kubectl get csv -n network-observability | grep netob
netobserv-operator.v0.2.1                NetObserv Operator                         0.2.1                  netobserv-operator.v0.2.0                      Succeeded
- Check the the new CRDs installed with the NetObserv Operator:
kubectl api-resources | grep netob
flowcollectors                                             flows.netobserv.io/v1alpha1                   false        FlowCollector
4. Deploying the NetObserv Flow Collector
The FlowCollector resource is used to configure the operator and its managed components. The full config documentation is available in the official github repo.
kubectl apply -k manifests/netobserv/instance/overlays/default/
FlowCollector operates cluster-wide, for that reason only a single FlowCollector is allowed, and it has to be named cluster.
- Let’s check the FlowCollector configuration that we deployed:
kubectl get flowcollector
NAME      AGENT   SAMPLING (EBPF)   DEPLOYMENT MODEL   STATUS
cluster   EBPF    50                DIRECT             Ready
As you can see the flowcollector at the cluster-wide (no namespace selected) have several configurations, so let’s start to dig a little bit deeper:
- Agent: can be EBPF (this case and the default one) or IPFIX (OVN-Kubernetes for example). EBPF is recommended and offers more performance.
- Sampling: value of flows sampled. By default is is set to 50 (1:50) for EBPF and 400 for IPFIX (1:400). This means that one flow of every 50 is sampled.
- Deployment Model: Direct model (no Kafka used)
-
Status: the actual status of the Netobserv FlowCollector
- The FlowCollector resource includes configuration of the Loki client, which is used by the processor (flowlogs-pipeline) to connect and send data to Loki for storage:
kubectl get flowcollector cluster -o jsonpath='{.spec.loki}' | jq -r .
{
  "authToken": "DISABLED",
  "batchSize": 10485760,
  "batchWait": "1s",
  "maxBackoff": "5s",
  "maxRetries": 2,
  "minBackoff": "1s",
  "staticLabels": {
    "app": "netobserv-flowcollector"
  },
  "tenantID": "netobserv",
  "timeout": "10s",
  "tls": {
    "caCert": {
      "certFile": "service-ca.crt",
      "name": "loki-ca-bundle",
      "type": "configmap"
    },
    "enable": false,
    "insecureSkipVerify": false,
    "userCert": {}
  },
  "url": "http://loki.netobserv.svc:3100/"
}
So as we checked the Loki instance is being used by the FlowCollector to store the Network Flow traffic to be queryable (and therefore have the possibility to create Grafana Dashboards with useful information).
- Check the the flowlogs-pipeline pods within the Netobserv:
kubectl get pod -n netobserv | grep pipeline
flowlogs-pipeline-ksnj8                               1/1     Running   0             57m
flowlogs-pipeline-mw4v2                               1/1     Running   0             57m
flowlogs-pipeline-p7knv                               1/1     Running   0             57m
flowlogs-pipeline-qc8bc                               1/1     Running   2 (31m ago)   57m
flowlogs-pipeline-vcfz2                               1/1     Running   0             57m
flowlogs-pipeline-z2dkt                               1/1     Running   0             57m
- These flowlogs-pipelines pods are controlled by a DaemonSet:
kubectl get ds -n netobserv

NAME                DESIRED   CURRENT   READY   UP-TO-DATE   AVAILABLE   NODE SELECTOR   AGE
flowlogs-pipeline   6         6         6       6            6           <none>          58m
- On the other hand, because the Agent is configured as type EBPF, the netobserv operator created the netobserv-privileged namespace with the netobserv-ebpf-agent DaemonSet deploying in each node the netobserv-ebpf-agent pods:
kubectl get ds -n netobserv-privileged netobserv-ebpf-agent
NAME                   DESIRED   CURRENT   READY   UP-TO-DATE   AVAILABLE   NODE SELECTOR   AGE
netobserv-ebpf-agent   6         6         6       6            6           <none>          64m
The Network Observability eBPF Agent allows collecting and aggregating all the ingress and egress flows on a Linux host (required a Kernel 4.18+ with eBPF enabled).
5. Netobserv Grafana Dashboards
Grafana can be used to retrieve and show the collected flows from Loki.
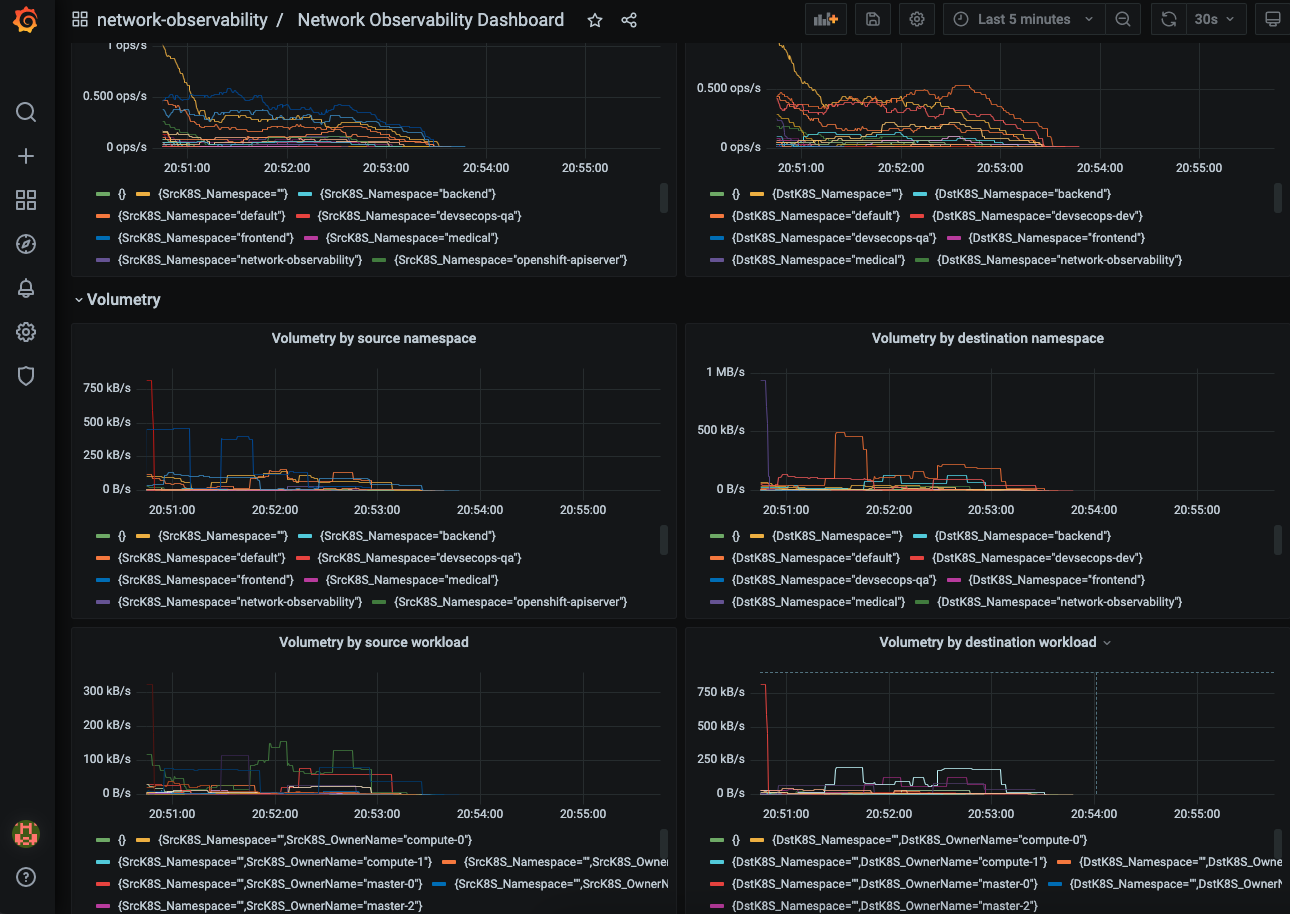
When we installed the Grafana dashboard and a Grafana Data Source, we deployed a Grafana Dashboard already ready to retrieve and show the collected Network Flow from Loki.
The Grafana Dashboard includes a table of the flows and some graphs showing the volumetry per source or destination namespaces or workload:
6. OpenShift Console Plugin
If the OpenShift Console is detected in the OpenShift cluster, the NetObserv console plugin is deployed when a FlowCollector is installed. It adds new pages and tabs to the OpenShift console.
- Overview Metrics - Charts on this page show overall, aggregated metrics on the cluster network:
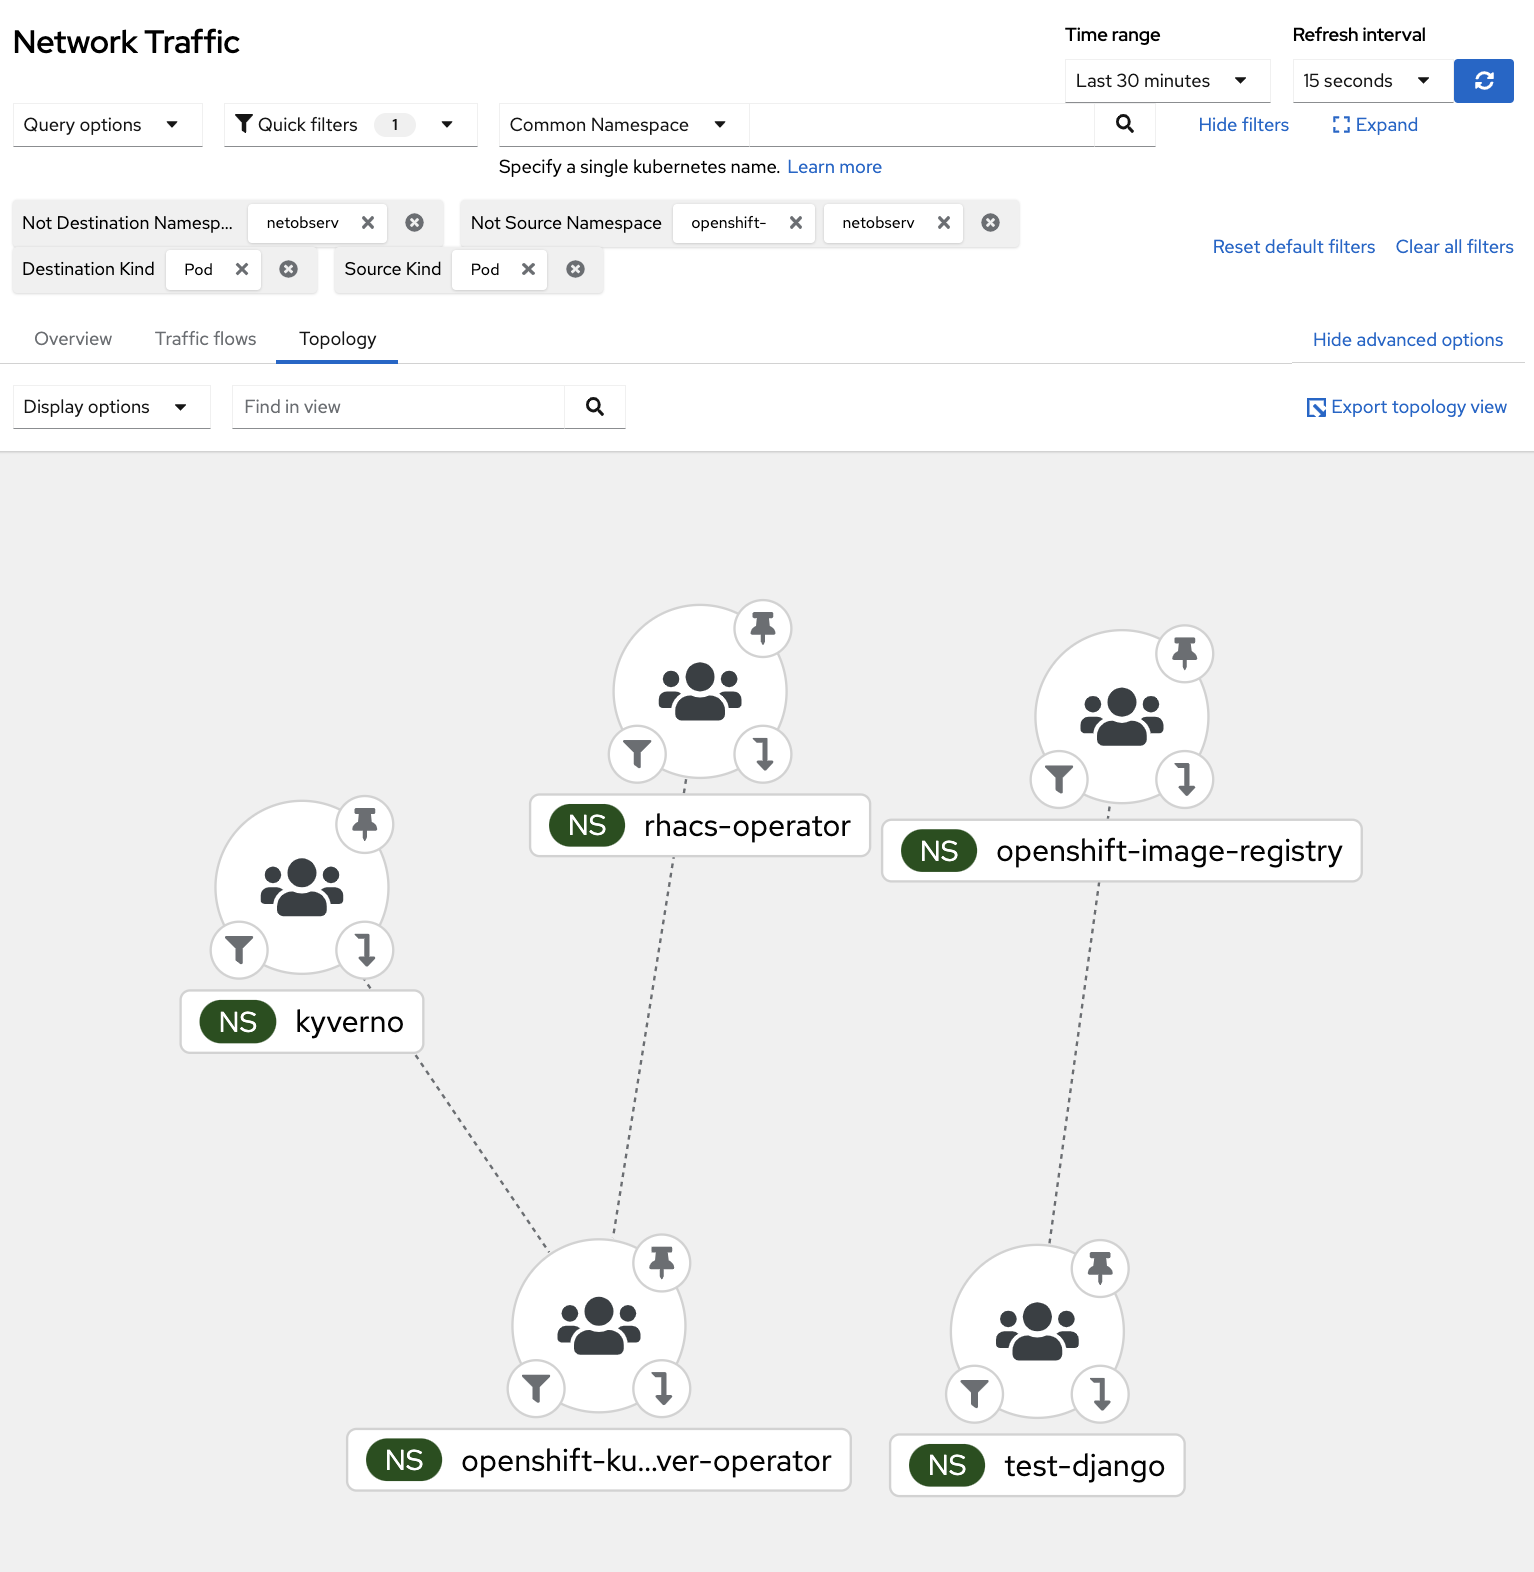
- Topology - The topology view represents traffic between elements as a graph:
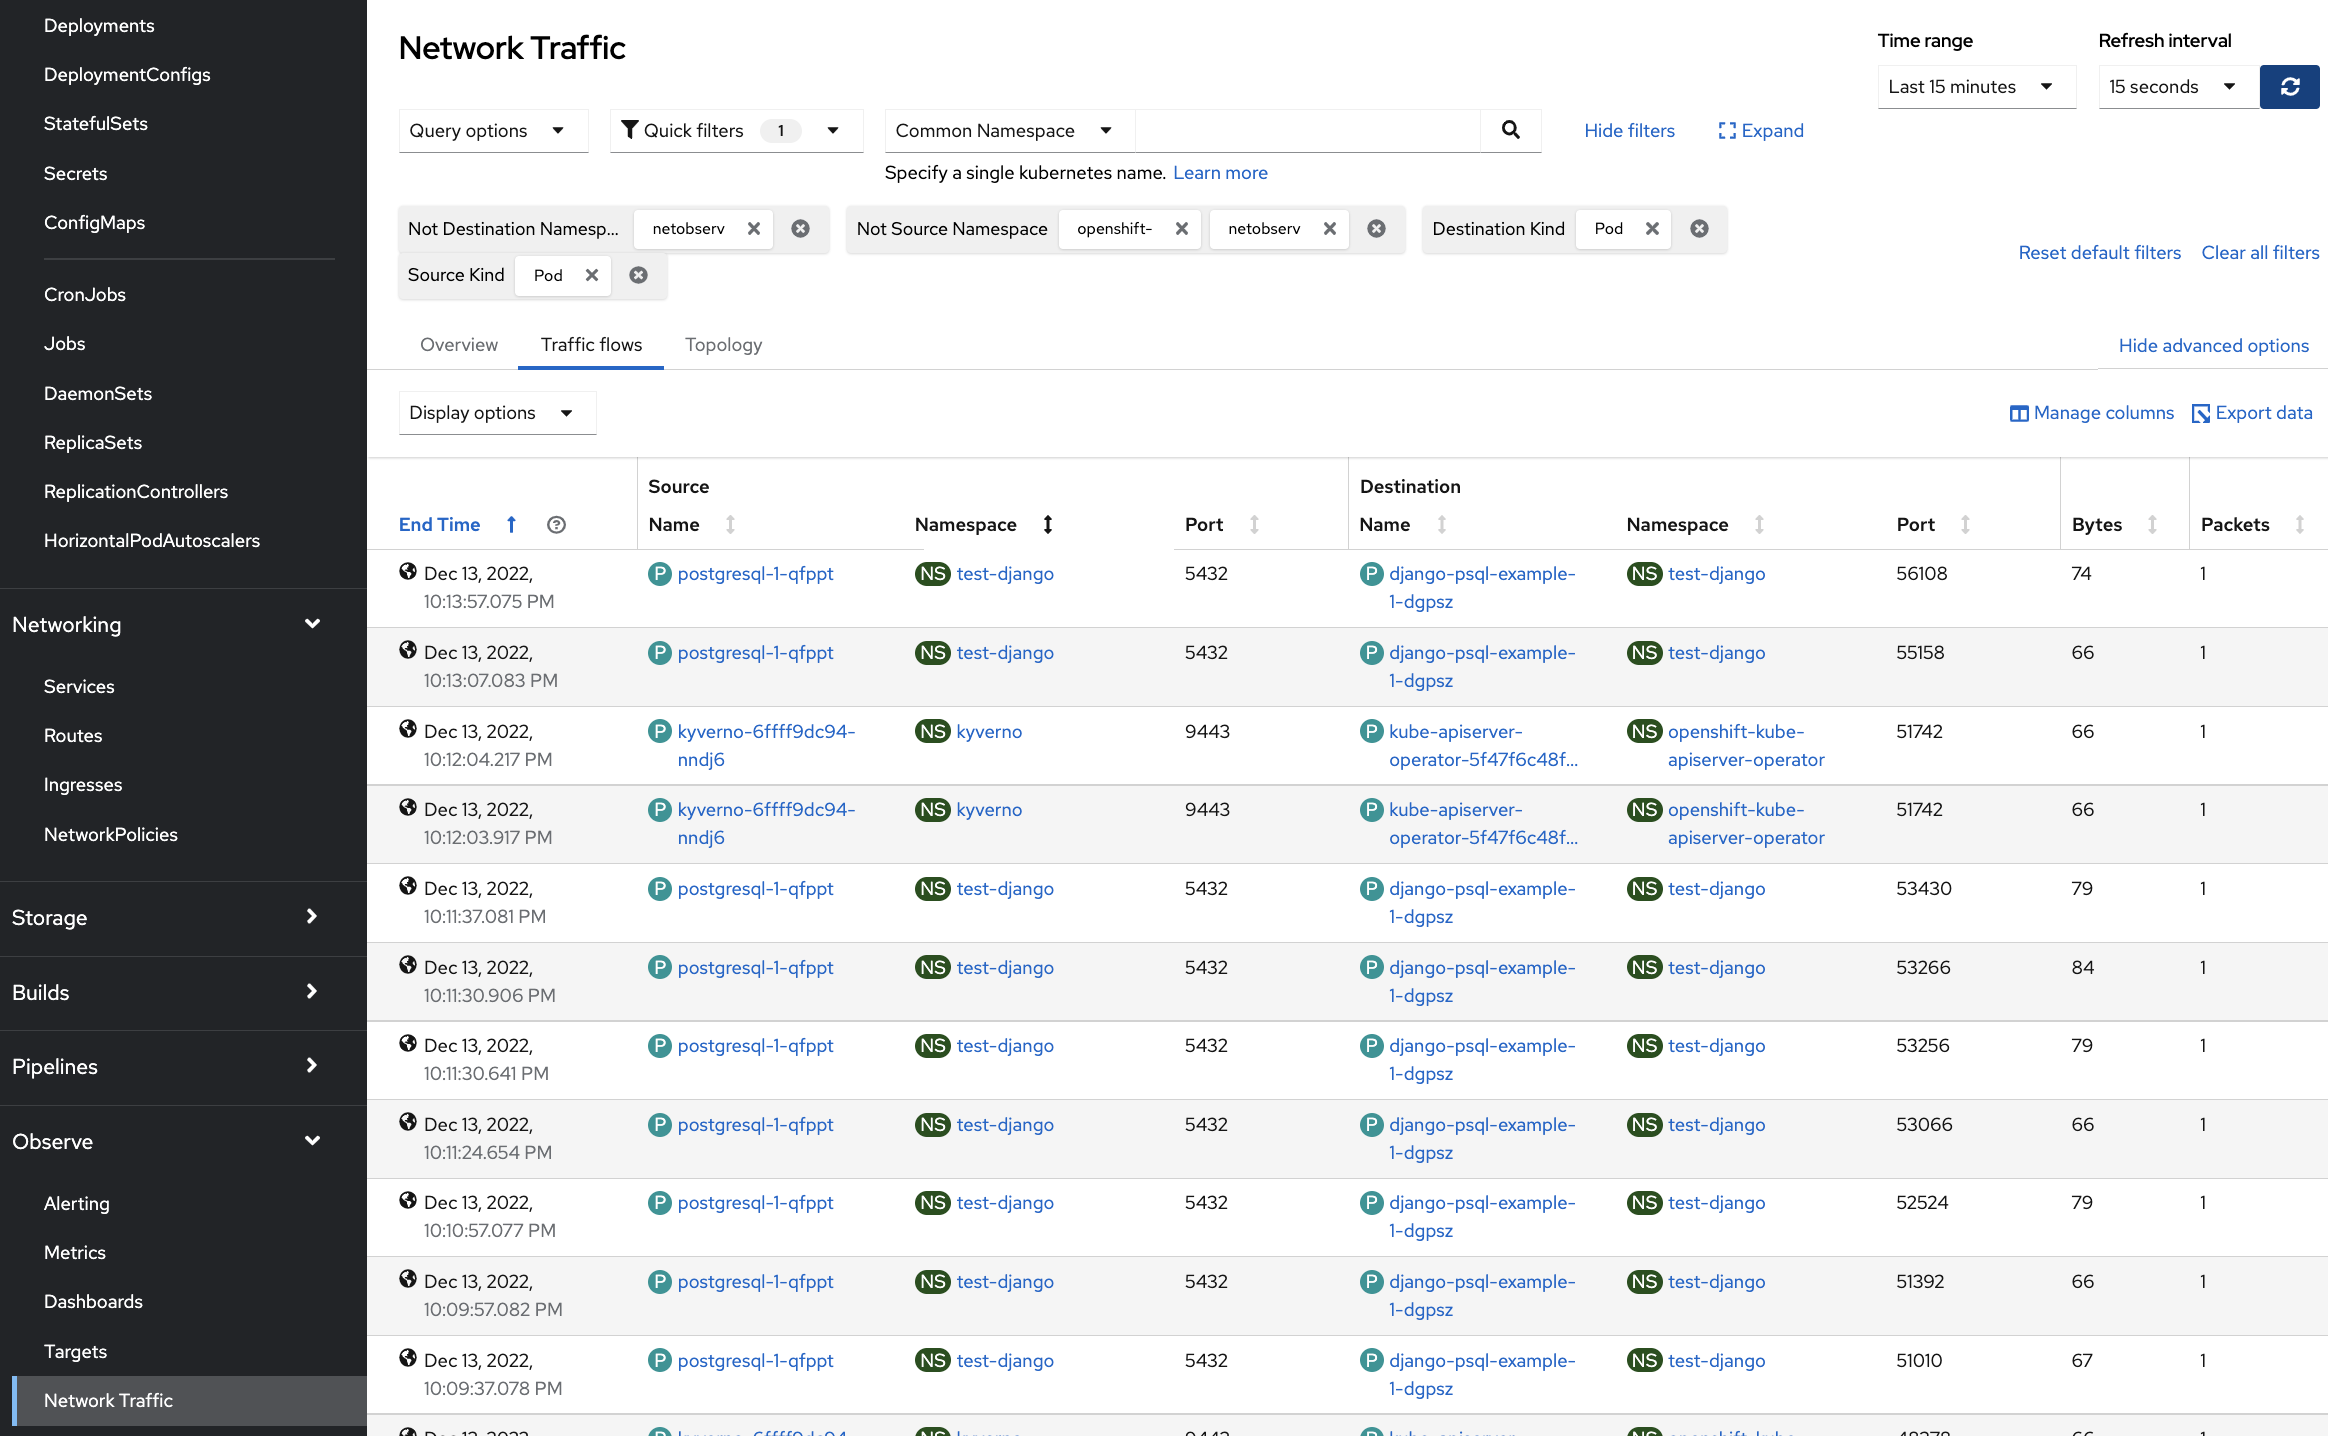
- Flow table - The table view shows raw flows, ie. non aggregated, still with the same filtering options, and configurable columns.
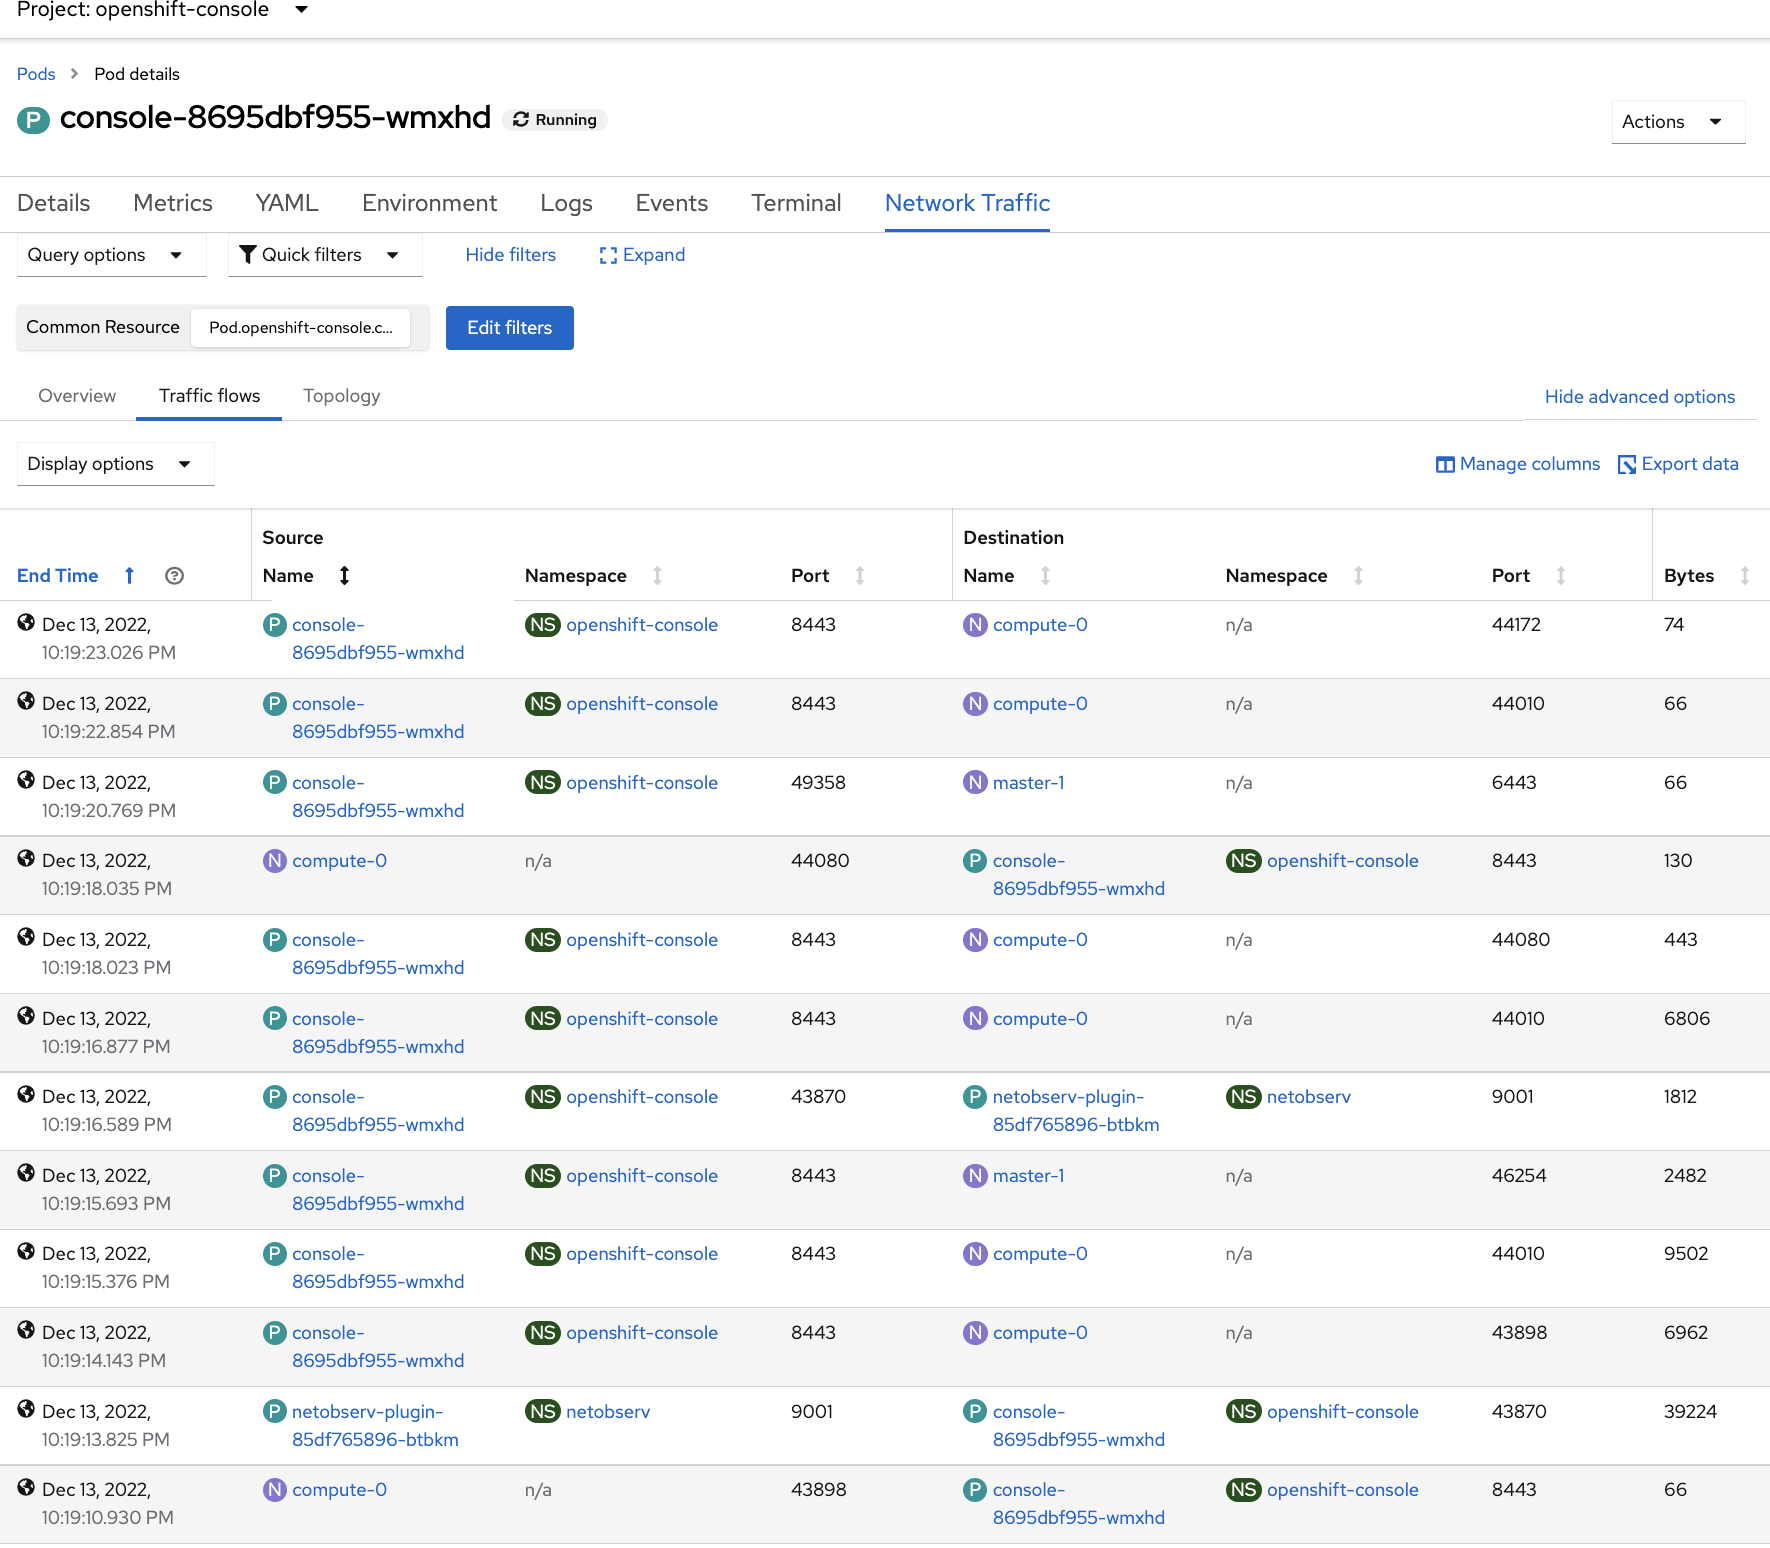
Also we can check the Network Traffic of some specific Pods, showing the Network Flow Traffic between the:
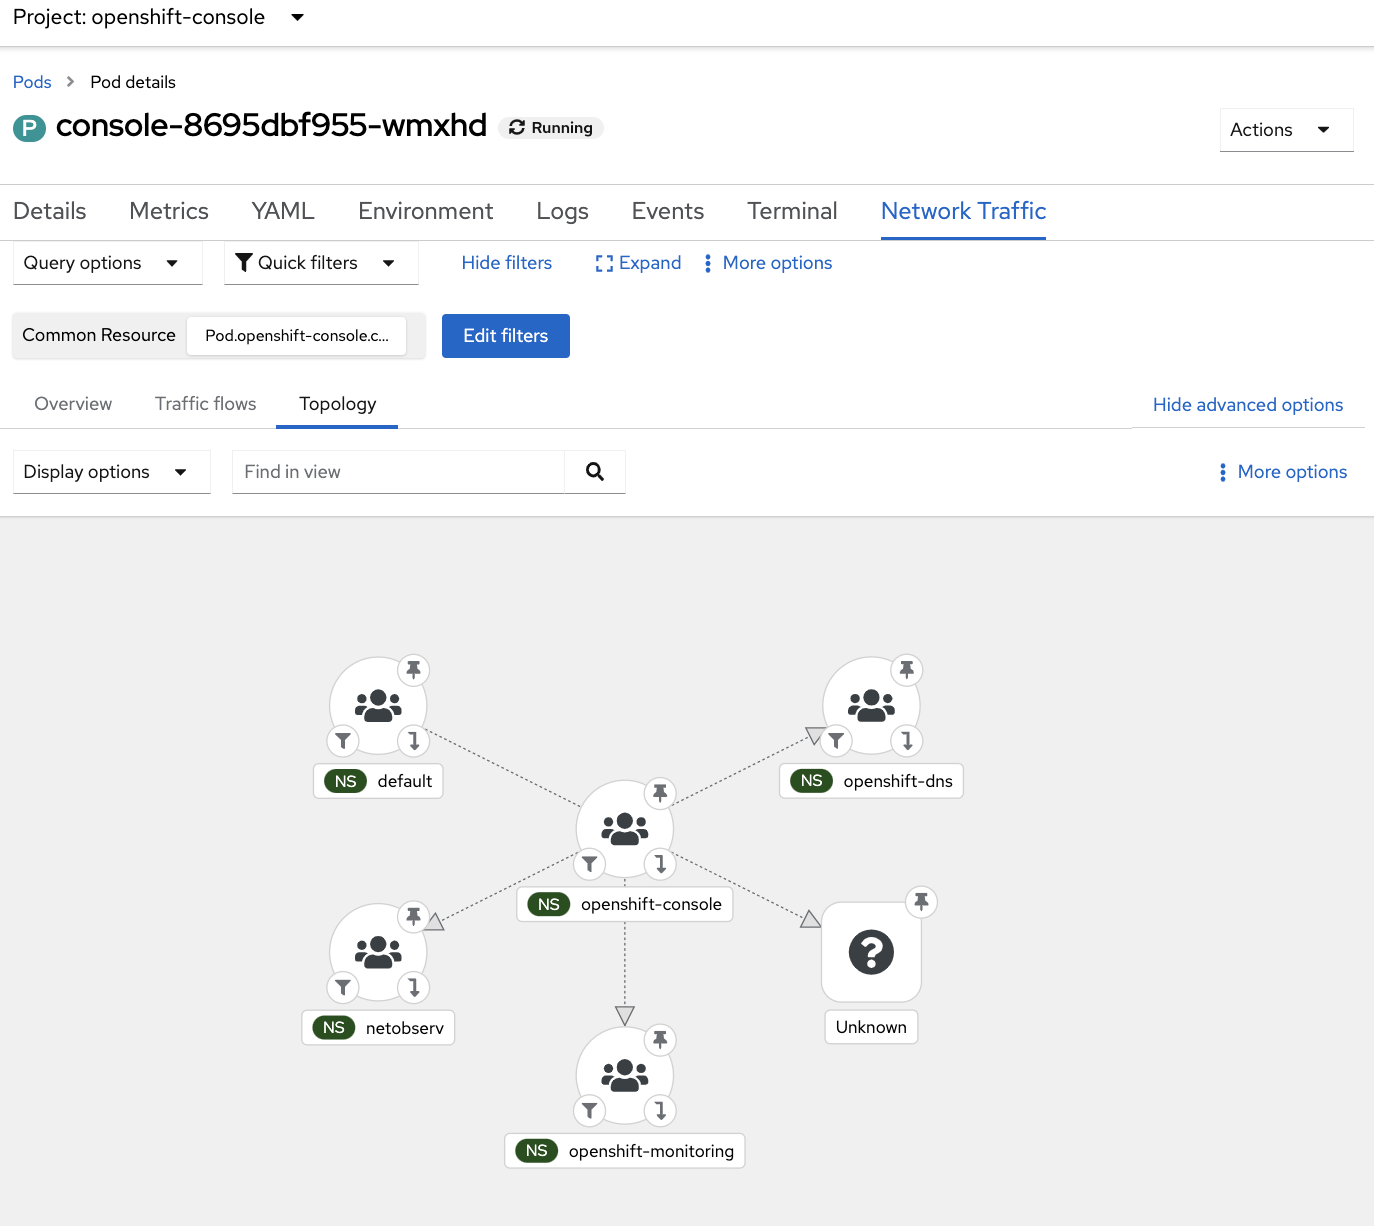
Furthermore we can check the topology of the Network Flow for our Pod connecting to other resources:
Finally we can check the metrics of the Network Flow traffic of our specific pod, giving very useful info around the flow traffic requests from and to our test Pod:
7. Deploying NetObserv using GitOps
Because we love GitOps in this blog, let’s deploy all of these steps (including Prerequisites) using GitOps and ArgoCD!
- Install OpenShift Pipelines / Tekton:
until kubectl apply -k bootstrap-argo/; do sleep 2; done
- After couple of minutes check the OpenShift GitOps and Pipelines:
ARGOCD_ROUTE=$(kubectl get route openshift-gitops-server -n openshift-gitops -o jsonpath='{.spec.host}{"\n"}')
curl -ks -o /dev/null -w "%{http_code}" https://$ARGOCD_ROUTE
- Deploy two Argo App of Apps for deploy Network Observability operators and dependencies automatically:
kubectl apply -k deploy-netobsv-argoapps/
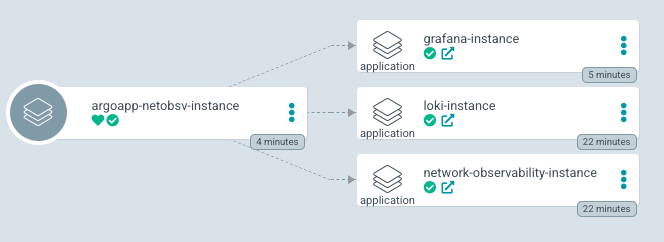
- This will deploy two Argo App of Apps that will deploy the operators and the instances of Network Observability, Grafana and Loki:
- The first Argo App of Apps will deploy the operators:
- The second Argo App of Apps will deploy the instances:
- These two Argo App of Apps will deploy and manage all Operators, k8s manifests, and prerequisites needed for deploy the Network Observability Operator:
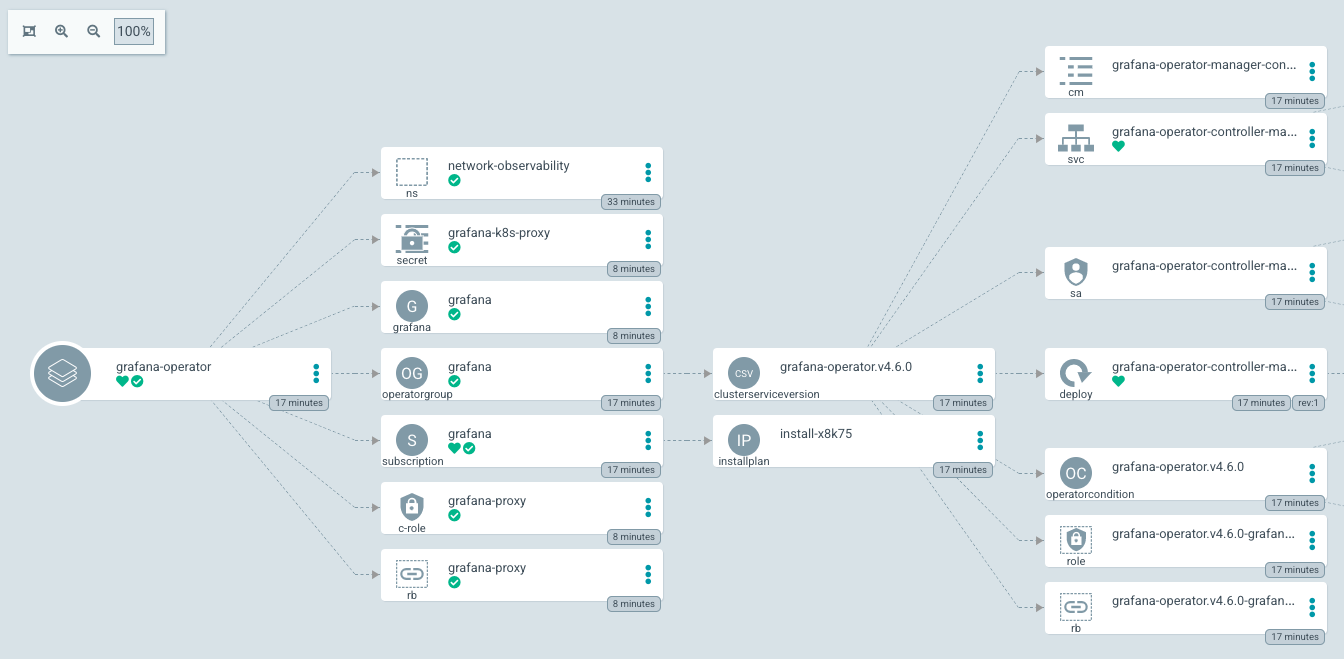
- For example the Grafana Operator Argo App will deploy, manage and sync all the bits and reqs needed for deploy the Grafana instance in the Network Observability namespace:
- After a bit, ArgoCD will deploy everything that is needed for the Network Observability demo.
And with that ends the third blog post around Network Observability in Kubernetes / OpenShift with NetObserv Operator.
NOTE: Opinions expressed in this blog are my own and do not necessarily reflect that of the company I work for.
Happy NetObserving!
