Testing eBPF in OpenShift 4
What is eBPF and how can I use it in OpenShift 4? What are the tools and the benefits of eBPF programs? How can run custom eBPF programs in our cluster to trace complex syscalls?
Let’s dig in!
1. Overview
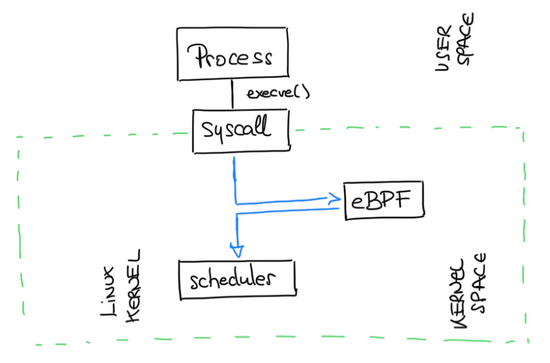
eBPF is a technology with origins in the Linux kernel that can run sandboxed programs in an operating system kernel.
It is used to safely and efficiently extend the capabilities of the kernel without requiring to change kernel source code or load kernel modules.
By allowing to run sandboxed programs within the operating system, application developers can run eBPF programs to add additional capabilities to the operating system at runtime.
The operating system then guarantees safety and execution efficiency as if natively compiled with the aid of a Just-In-Time (JIT) compiler and verification engine.
This has led to a wave of eBPF-based projects covering a wide array of use cases, including next-generation networking, observability, and security functionality.
eBPF programs are event-driven and are run when the kernel or an application passes a certain hook point. Pre-defined hooks include system calls, function entry/exit, kernel tracepoints, network events, and several others.
2. Kubectl Trace - A kubectl plugin based in eBPF programs
In a lot of scenarios, eBPF is not used directly but indirectly via projects like bcc, or bpftrace which provide an abstraction on top of eBPF and do not require to write programs directly but instead offer the ability to specify intent-based definitions which are then implemented with eBPF.
While it is of course possible to write bytecode directly, the more common development practice is to leverage a compiler suite like LLVM to compile pseudo-C code into eBPF bytecode.
Let’s present the Kubectl Trace and BPFTrace!
Kubectl trace is a kubectl plugin that allows you to schedule the execution of bpftrace programs in your Kubernetes cluster.
bpftrace is a high-level tracing language for Linux enhanced Berkeley Packet Filter (eBPF) available in recent Linux kernels (4.x).
bpftrace uses LLVM as a backend to compile scripts to BPF-bytecode and makes use of BCC for interacting with the Linux BPF system, as well as existing Linux tracing capabilities.
- Follow the installation guide to install kubectl-trace with krew.
3. Prereqs to run eBPF programs in OpenShift
There are a serie of good examples in the bpftrace repo that are handy and some of them we’ll be tested in this blog post.
- First download examples of bpftrace
git clone https://github.com/iovisor/bpftrace
cd bpftrace/tools/
- Add privileged mode for the default serviceaccount into the namespace ebpf
oc new-project ebpf
oc adm policy add-scc-to-user privileged -z default -n ebpf
NOTE: this is NOT recommended for a productive environment, nor other critical environments. It’s just a PoC, so please DON’T do it in prod/pre environments. Use the proper SAs with the proper rbac :)
4. Running eBPF programs in OpenShift 4
Let’s pick one node and run the kubectl-trace with several ePBF bpftrace programs in our test cluster.
- Select one of the masters nodes to check the kubectl trace ebpf programs to.
MASTER=$(kubectl get nodes | grep master | awk '{ print $1 }'| head -n1)
4.1 Tracing the capabilities into the kernel
- Run the kubectl-trace run with the
capable.btprogram
kubectl-trace run $MASTER -f capable.bt
Capable traces calls to the kernel cap_capable() function, which does security capability checks, and prints details for each call.
- Check the logs to see the trace calls of the capabilities:
kubectl logs --tail=10 kubectl-trace-fff6b80d-c076-49be-abc5-c110ee5aaca1-lhk9m
14:11:03  0      1700   kubelet          2    CAP_DAC_READ_SEARCH  0
14:11:03  0      1700   kubelet          19   CAP_SYS_PTRACE       0
14:11:03  0      1700   kubelet          2    CAP_DAC_READ_SEARCH  0
14:11:03  0      1700   kubelet          19   CAP_SYS_PTRACE       0
14:11:03  0      1700   kubelet          2    CAP_DAC_READ_SEARCH  0
14:11:03  0      1700   kubelet          19   CAP_SYS_PTRACE       0
14:11:03  0      1700   kubelet          2    CAP_DAC_READ_SEARCH  0
14:11:03  0      1700   kubelet          19   CAP_SYS_PTRACE       0
14:11:03  0      1700   kubelet          2    CAP_DAC_READ_SEARCH  0
14:11:03  0      1700   kubelet          19   CAP_SYS_PTRACE       0
4.2 Tracing the Linux Virtual FileSystem calls into the kernel
- Run the kubectl-trace run with the
vfsstat.btprogram
kubectl-trace run ip-10-0-158-239.eu-central-1.compute.internal -f vfsstat.bt
This traces some common Linux Virtual FileSystem (LVF) calls and prints per-second summaries:
- Check the logs to see the trace calls of the LVF syscalls:
kubectl logs --tail=10 kubectl-trace-f688e097-29c5-44ee-85c9-3db947fed24a-8q8xt
@[vfs_open]: 873
@[vfs_read]: 2783

14:42:22
@[vfs_writev]: 7
@[vfs_readlink]: 317
@[vfs_write]: 811
@[vfs_open]: 2176
@[vfs_read]: 4084
4.3 Tracing the System Load Averages with eBPF
- Run the kubectl-trace run with the
loads.btprogram.
kubectl-trace run ip-10-0-158-239.eu-central-1.compute.internal -f loads.bt
This is a simple tool that prints the system load averages, as a demonstration of fetching kernel structures from bpftrace.
- Check the logs to see the trace calls of the system load averages:
kubectl logs kubectl-trace-b3ce5771-1a56-467d-a2eb-66b0b99c171b-fx2hv --tail=10
14:47:37 load averages: 0.361 0.446 0.501
14:47:38 load averages: 0.361 0.446 0.501
14:47:39 load averages: 0.332 0.438 0.498
14:47:40 load averages: 0.332 0.438 0.498
14:47:41 load averages: 0.332 0.438 0.498
14:47:42 load averages: 0.332 0.438 0.498
14:47:43 load averages: 0.332 0.438 0.498
14:47:44 load averages: 0.305 0.431 0.495
14:47:45 load averages: 0.305 0.431 0.495
14:47:46 load averages: 0.305 0.431 0.495
With that we demonstrate how to use eBPF programs in our OpenShift 4 clusters, and how can we benefit of the eBPF toolset and eBPF programs in OpenShift clusters.
NOTE: Opinions expressed in this blog are my own and do not necessarily reflect that of the company I work for.
Stay tuned and happy eBPFing!


